


Bank statement analysis turns a raw statement into a decision. It is how a lender judges whether to approve a loan, how an accountant reconciles a client’s month, and how an individual sees where their money actually goes.
The statement is dense with information, but not in a usable shape. Analysis is the work of turning pages of transactions into a few numbers and signals a person can act on.
The word “analysis” is what separates it from simple conversion. Pulling transactions into a spreadsheet is extraction; interpreting them into income, spending, and risk signals is analysis. This guide explains how the full process works, the metrics that carry the decision, the red flags reviewers check, and where automation genuinely helps.
That distinction matters more than it sounds. Confusing a converter with an analyzer is one of the most common and costly mistakes buyers make, and much of this guide comes back to it.
How Bank Statement Analysis Actually Works
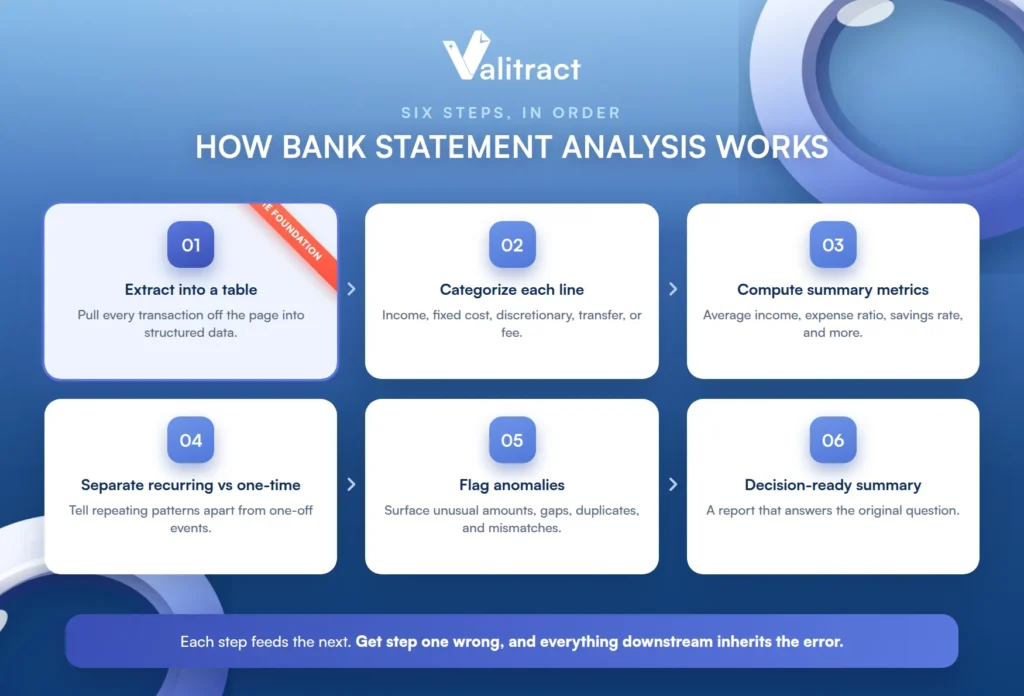
The process runs in six steps, and each one feeds the next. Skip a step, or get it wrong, and everything downstream inherits the error.
Step 1: Extract Transactions Into a Structured Table
First, the data has to come off the page. Every transaction (date, description, amount, and running balance) is pulled from the statement into a clean, structured table. This is the foundation, because nothing can be analyzed while it is still trapped in a PDF, and accurate bank statement data extraction is what makes the rest possible.
This step is also where accuracy is won or lost. A number misread here is inherited by every metric and flag that follows, with nowhere upstream for the error to have come from.
Step 2: Categorize Each Transaction
Next, every transaction is labeled. Each line is sorted into a category such as income, fixed cost, discretionary spending, transfer, or fee. Consistent categorization is what lets the numbers add up into meaningful totals, and inconsistent labels quietly break every calculation that follows.
This is where analysis starts to diverge from extraction. Reading the line is a data problem, but deciding what the line means is a judgment the analysis layer has to make.
Step 3: Compute Summary Metrics
With clean, categorized data, the metrics can be calculated. This is where average monthly income, expense ratios, savings rate, and other figures are computed from the categorized totals. These numbers are the raw material of the eventual decision.
The math itself is simple, but it depends entirely on the steps before it. A ratio computed on miscategorized data is precise and wrong at the same time.
Step 4: Separate Recurring From One-Time Transactions
Not every transaction means the same thing. A recurring salary deposit is very different from a one-time gift, and a monthly subscription is different from a single large purchase. Separating the repeating patterns from the one-offs is what reveals the true, sustainable picture of income and obligations.
This is often where a shaky application unravels. A one-time deposit dressed up as regular income looks fine until the recurring pattern is checked and it is not there.
Step 5: Flag Anomalies
Now the analysis looks for what does not fit. Unusual amounts, unexpected gaps, duplicate entries, and balances that do not reconcile are flagged for a closer look. This step is where fraud signals and data-quality problems both surface.
Not every flag is fraud. Many anomalies turn out to be extraction slips or ordinary but unusual transactions, which is why flags trigger review rather than automatic rejection.
Step 6: Produce a Decision-Ready Summary
Finally, it all becomes a summary someone can act on. The categorized data, computed metrics, and flagged anomalies are pulled into a report that answers the original question: is this borrower creditworthy, is this month reconciled, is this budget healthy?
The quality of that summary traces straight back to step one. A decision-ready report built on an inaccurate read is confident and wrong, which is the most dangerous combination of all.
The Metrics That Actually Carry the Decision
A handful of metrics do most of the work in any analysis. These are the numbers that a lender, accountant, or individual actually acts on.
Each one only means something on clean, reconciled data. A metric is a summary of the underlying transactions, so it is only ever as trustworthy as the extraction beneath it.
Table 1. The core bank statement analysis metrics.
| Metric | What it measures | Why it matters |
| Average monthly income | Typical income across the period | Establishes baseline repayment capacity and stability |
| Expense ratio | Expenses as a share of income | Shows how much income is consumed by spending |
| Savings rate | Income retained after expenses | Signals financial cushion and discipline |
| Debt-to-income (DTI) | Debt obligations against income | The core affordability metric in lending |
| NSF / overdraft count | Times the account bounced or went negative | A direct signal of liquidity stress and risk |
| Lowest balance | The minimum balance in the period | Shows how close to zero the account runs |
| Recurring obligations | Fixed, repeating payments | Reveals committed outflows that reduce free cash |
No single metric decides anything on its own. It is the combination, read together, that tells the real story of a person’s or business’s finances.
Context changes their weight, too. A low savings rate means one thing for a growing business reinvesting cash and another for a household living paycheck to paycheck.
Red Flags Analysts Actually Check
Beyond the metrics, reviewers scan for specific warning signs. These are the patterns that prompt a second look, framed as what an analyst looks for.
- Round-number deposits without a clear source, which can indicate income that is not what it appears to be.
- Repeated NSF or bounced payments, a strong signal of liquidity stress.
- Duplicate payments to the same payee, which may be an error or something worth questioning.
- Unfamiliar or unrecognized payees, especially for large or regular amounts.
- Inter-account transfers staged to look like income, where money moved between a person’s own accounts is presented as earnings.
- Balance-reconciliation mismatches, where the debits and credits do not add up to the stated closing balance.
- PDF metadata inconsistencies, which can signal a document edited after it was issued.
A single flag is rarely conclusive. Analysts weigh them together and in context, and most flags simply mean a transaction deserves a closer look rather than proof of a problem.
The document-integrity checks are their own category. Balance mismatches and metadata signals point to data or document problems, which is a different question from whether the finances themselves look healthy.
Who Actually Does This, and What Changes by Audience
The same process serves very different people, and the emphasis shifts with each. What one audience treats as the whole point, another barely uses.
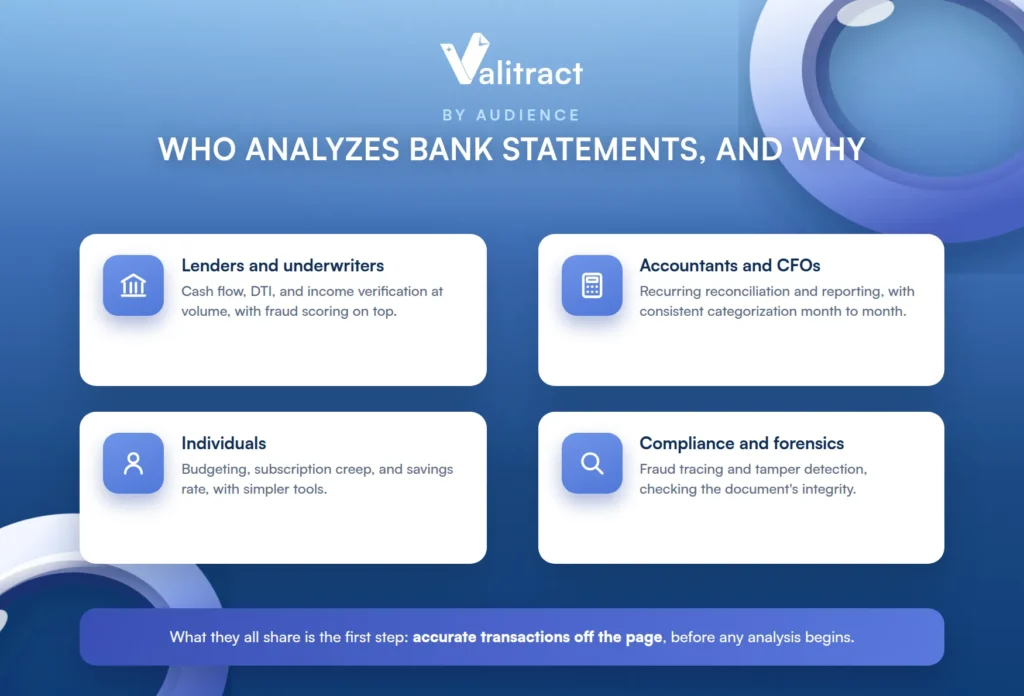
What they all share is the first step. Every one of them needs accurate transactions off the page before their particular version of analysis can begin.
Lenders and Underwriters
Lenders analyze statements to make credit decisions at volume. Their focus is cash flow, debt-to-income, and income verification, often with fraud scoring layered on top. Speed and consistency matter as much as accuracy, because they are processing many applications against the same criteria.
This is the audience most exposed to the extraction-versus-analysis gap. Many teams solve the reading and then discover, weeks later, that they have automated data entry and not underwriting.
Accountants, Bookkeepers, and CFOs
Finance professionals use analysis for recurring reconciliation and reporting. Their emphasis is on expense tracking, categorizing transactions correctly month after month, and producing clean client or management reports. Consistency across periods is the priority, since their work is ongoing rather than a one-time check.
For them, the same categories have to mean the same thing every month. A rule that drifts between periods quietly corrupts the trend lines their reports depend on.
Individuals
For individuals, analysis is about understanding their own money. Budgeting, spotting subscription creep, and tracking savings rate are the common goals. The bar is lower and the tools are simpler, but the underlying process (categorize, summarize, interpret) is the same.
Most people never call it analysis. Checking where the money went last month is exactly this process, just with a friendlier interface and lower stakes.
Compliance and Forensic Reviewers
Compliance and forensic reviewers look for what others miss. Their focus is fraud tracing and tamper detection, examining not just the numbers but the integrity of the document itself. This is the most specialized version of the work, and it is a distinct discipline from routine analysis.
It is also a separate tool layer from extraction. Reading the numbers accurately and proving a document was not altered are two different problems, solved by two different kinds of software.
Where Automation Actually Helps, and Where It Doesn’t
Extraction is the first step in every version of this process, and it is also the step where manual workflows most often break down. Inconsistent categorization, missed rows on multi-page statements, and hours of manual cleanup all start here, which is why automating the read is where the clearest, fastest return lives.
Manual reading does not scale, and it does not stay accurate. A person keying a multi-page statement is both the slowest part of the process and the most likely source of an error.
This is exactly the step Valitract is built for. It provides template-free extraction across bank formats, structured JSON, CSV, or XLS output, and both a no-code interface and an API, turning a messy PDF, scan, or photo into a clean transaction table without per-bank templates. For a deeper comparison of tools at this step, see our guide to the best bank statement extraction software.
Getting this layer right removes the biggest bottleneck in the whole process. Once the read is clean and consistent, the analysis on top of it becomes a far easier problem.
The honest handoff comes after extraction. If your next step is categorization, credit scoring, or fraud decisioning, that is a different tool layer, and it is worth being clear about who does what. In lending, platforms like Ocrolus and Inscribe add income analytics and fraud models, while bank-link APIs like Plaid connect accounts directly; in bookkeeping, tools like Dext, QuickBooks, and Docyt handle categorization and reconciliation; for personal finance, apps like YNAB, Monarch, and Copilot do the budgeting layer. Valitract provides the accurate extraction that feeds any of these, and it does not perform the scoring, categorization, or fraud-decisioning layer itself.
Being clear about that boundary is a feature, not a limitation. A clean, accurate extraction layer makes every one of those downstream tools work better, because they all inherit the quality of the data they are handed.
Common Mistakes in Bank Statement Analysis
A few recurring errors undermine otherwise good analysis. Each one is easy to avoid once you know to look for it.
Most of them share a root cause. They come from treating the pipeline as one undifferentiated task instead of a sequence of distinct steps, each with its own kind of accuracy.
The first is treating a clean sample PDF as representative of your actual statement mix. A tool that shines on a tidy demo file can struggle on the scanned, multi-bank, real-world statements you actually process.
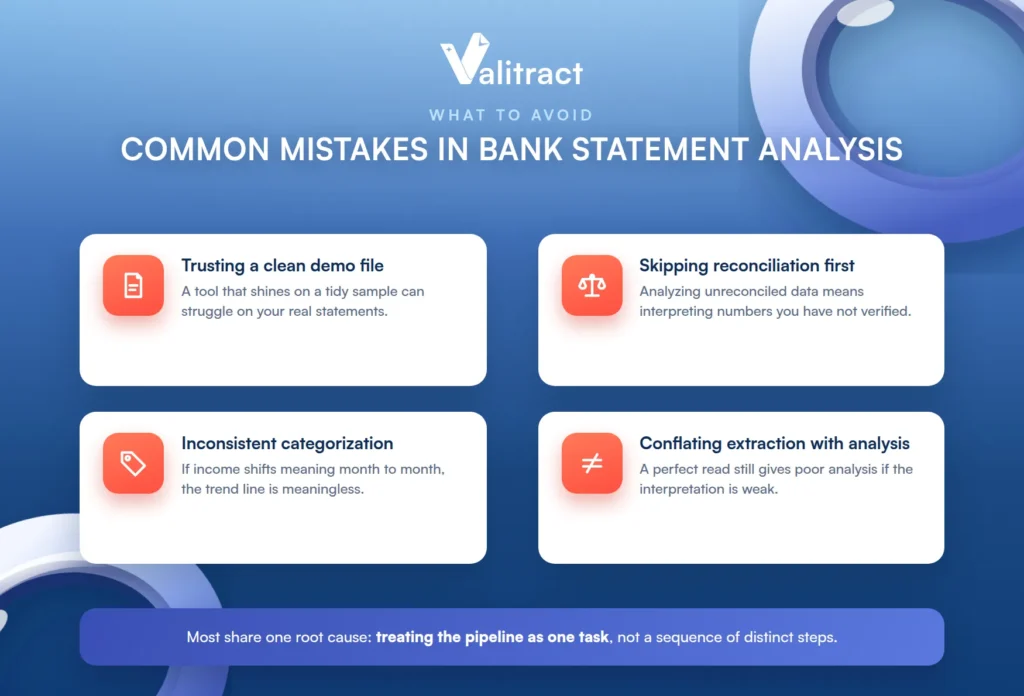
The second is skipping reconciliation before running trend analysis. Reconciliation confirms the data is complete and internally consistent, while analysis interprets it; the two are sequential, not interchangeable, and analyzing unreconciled data means interpreting numbers you have not verified. Our guide to bank statement reconciliation covers this step in detail.
The third is inconsistent categorization across months or clients, which quietly breaks every downstream calculation. If “income” means one thing in January and another in February, the trend line is meaningless.
The fourth is conflating extraction accuracy with analysis accuracy, as if they were the same claim. A tool can read every number perfectly and still produce a poor analysis if the categorization or interpretation on top of it is weak.
Frequently Asked Questions About Bank Statement Analysis
What is bank statement analysis? It is the process of extracting, categorizing, and interpreting the transactions on a bank statement to assess financial health, cash flow, or creditworthiness. The output is a summary of income, expenses, ratios, and red flags, not just a table of raw data. Extraction is the first step, and analysis is the interpretation built on top of it.
What is the difference between a bank statement analyzer and a bank statement converter? A converter extracts transactions from a statement into structured data such as CSV or Excel, and stops there. An analyzer takes that structured data further, categorizing transactions, computing metrics, and producing insights. Conversion is a prerequisite for analysis, not a substitute for it.
Can AI or ChatGPT reliably analyze a bank statement? General AI tools can summarize a statement, but they are not reliable for decisions, because they can misread figures and do not validate that totals reconcile. Purpose-built tools separate accurate extraction from interpretation and keep a human in the loop for anything that carries a financial decision. For anything high-stakes, verify the extracted numbers before trusting the analysis.
What red flags do lenders look for in a bank statement? Common ones include repeated NSF or overdraft events, round-number deposits without a clear source, transfers staged to look like income, unfamiliar payees, and balances that do not reconcile. Reviewers also check the document itself for signs it was edited after issue. Any single flag usually prompts a closer look rather than an automatic rejection.
How many months of statements should you analyze? Three months is a common minimum, and six to twelve months is typical for lending or a thorough financial review. A longer window smooths out one-off events and reveals genuine recurring patterns. The right number depends on the decision: budgeting can use less, while underwriting usually wants more.
Is bank statement analysis the same as bank reconciliation? No. Reconciliation confirms that the transactions and balances are complete and internally consistent, while analysis interprets that verified data into insights. Reconciliation comes first and answers “is this data correct,” and analysis comes second and answers “what does this data mean.”
Conclusion
Bank statement analysis is the full journey from a raw statement to a decision, and it always begins with getting the data off the page accurately. Extraction, categorization, computation, and interpretation each build on the step before, which is why the accuracy of that first read shapes everything after it.
Understanding the pipeline as distinct steps is what lets you buy well. You match each layer to the right tool instead of expecting one product to do all of it.
Valitract owns that first step: fast, template-free, validated extraction that feeds whatever analysis, scoring, or bookkeeping tool comes next. To see it on your own statements, book a demo with the Valitract team.