


- PDF table extraction is the process of recovering rows, columns, and cell relationships from a table inside a PDF and outputting them as structured data (CSV, JSON, XLS, or HTML), not just as loose text.
- It is hard because a PDF stores glyphs at coordinates, not a table object, so every tool is reconstructing structure from visual evidence.
- Text-layer PDFs with real ruled borders are solved by free libraries; borderless, merged, multi-page, and scanned tables need layout-aware or AI-native extraction.
PDF table extraction breaks for one reason that most guides never state: the PDF you are extracting from does not actually contain a table. It contains characters placed at coordinates that happen to look like a table to your eye, and every tool has to reverse-engineer the grid from that.
Once you understand that, the failures stop being mysterious and start being predictable. This guide explains why the table is not really there, the five table types that break extraction, the four methods tools use to reconstruct structure, and how to pick and test an approach on your own worst documents.
Why a PDF Doesn’t Actually Contain a Table
A PDF records each cell’s characters at XY coordinates with font metrics, and nothing more. There is no row object, no column definition, and no cell boundary anywhere in the file, only glyphs arranged on the page so that a human reads them as a grid.
This matters more than it sounds. The “table” you see is an inference your eye makes from alignment and spacing, and an extraction tool has to make the same inference from weaker evidence, with none of the context you bring to the page.
Two classes of PDF behave completely differently here, and knowing which one you have decides everything. A text-layer PDF is digitally generated and carries the characters as selectable text; an image-only PDF is a scan or photograph with no text underneath. The one-second test: if you can click and drag to select the text, there is a text layer, and if you cannot, there is not.
The case that surprises people most is financial and ERP-generated PDFs, which often draw table borders with text characters rather than real line objects. A border-detection tool then sees no table at all on a page that looks perfectly ruled, because the lines it is looking for are not lines, they are rows of dashes and pipes.
The Five Table Types That Break Extraction
Before choosing a tool, find your document in this taxonomy, because the type of table you have predicts how it will fail. Most real document sets contain several of these at once.
| Table type | What makes it hard | Typical failure |
|---|---|---|
| Bordered / ruled | Nothing, if the borders are real line objects | Fails silently when borders are text-drawn, not vector lines |
| Borderless | Column boundaries exist only as whitespace | Adjacent columns merge, or one column splits into two |
| Merged / nested headers | Row and column spans must be reconstructed, not just aligned | A spanning header is copied into the wrong columns |
| Multi-page | Rows continue past a page break; headers repeat or change | One table becomes several unrelated tables |
| Scanned or photographed | No text layer at all, so OCR must run first | Coordinate-based tools return nothing and report no error |
Most production document sets contain three or four of these types at once, which is why single-method tools underperform on real mixes even after scoring well on a clean demo file.
The practical takeaway is that a tool which aces one type can be useless on another. Scoring a tool on your cleanest ruled table tells you almost nothing about how it will handle the borderless, merged, and scanned tables sitting in the same folder.
How PDF Table Extraction Actually Works: Four Detection Methods
Every extraction tool uses one of four methods to reconstruct structure, and knowing which one yours uses tells you why it broke. Think of this as diagnosis rather than theory.
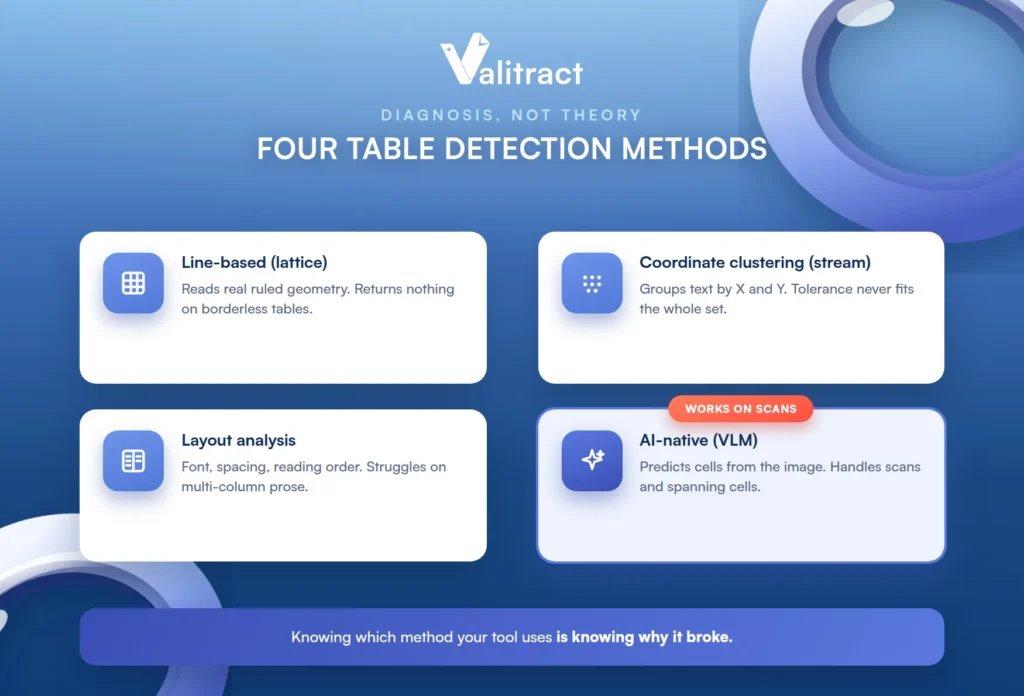
Line-based detection (lattice)
This method renders the page, runs edge detection to find horizontal and vertical rules, computes their intersections, and maps text into the resulting cells. On genuinely ruled tables it offers the highest precision available, because it is reading real geometry.
Its failure mode is total: borderless tables and text-drawn separators produce zero detected tables, because there are no line objects to find. It does not return a bad table; it returns nothing.
Coordinate clustering (stream)
This method skips line detection entirely and groups text by X-position proximity to infer columns and Y-position to infer rows. It is what you reach for when there are no borders to detect.
Its failure mode is the single most-reported frustration in practitioner threads: unevenly spaced or tightly packed columns. The tolerance setting that fixes over-merging on one document causes under-merging on the next, so you tune it forever and never get it right for the whole set.
Layout analysis
This method uses font size, spacing, and rendering order to reconstruct reading order and separate table regions from surrounding prose. It is stronger than raw clustering when a page mixes narrative and tables.
Its failure mode is the multi-column page, where narrative text sits beside a table and the analyzer struggles to decide what belongs to the table and what does not.
AI-native and vision-language extraction
This method processes the rendered page image and predicts cell structure directly. It is the only approach that works on scans, and it handles borderless tables and spanning cells in one pass, because it is reasoning about the whole page the way a person would.
Its failure mode is different in kind: on very dense tables a model can omit rows or generate plausible-looking ones, which is exactly why confidence scores and validation matter more here than anywhere else. Valitract is one working example of the template-free AI-native path, preserving row and column relationships, outputting JSON, CSV, or XLS, and flagging low-confidence fields for human review. Our guide to OCR data extraction describes the underlying pipeline in full.
Which Extraction Approach Fits Your Documents
There is no best tool, only the right one for your documents, your stack, and your constraints. This table maps common situations to an honest recommendation, including the free options that genuinely win in their lane.
| Your situation | Fit | Why |
|---|---|---|
| Text-layer PDFs, ruled tables, Python available | pdfplumber or Camelot | Free, configurable, pandas-native; Camelot adds a visual debugger and a per-table accuracy score |
| Quick batch across many clean digital files | Tabula | One call covers all pages; needs a Java runtime |
| Scanned, photographed, or mixed-quality documents | AI-native extraction (Valitract, cloud document APIs) | OCR and structure prediction happen in one pass; coordinate tools return nothing here |
| Documents cannot leave your infrastructure | Local VLM stack (Docling, Surya or Marker) | Fully local and open-source; requires a GPU or llama.cpp and real setup time |
| Already standardized on AWS, GCP, or Azure | Textract, Document AI, or Azure Document Intelligence | Identity, regions, and logging already live in the same cloud |
| No-code or RPA workflow, no developer time | A drag-and-drop extraction UI with export or webhook | Avoids premium-connector and AI-credit blocks in Power Automate and similar tools |
If you have 200 clean, ruled, text-layer PDFs and a Python environment, use pdfplumber and do not overthink it; the free library is genuinely the right answer, and saying so is what makes the rest of this article trustworthy. The AI-native row earns its place only when the free tools return nothing, which is on scans, photos, and messy borderless mixes.
One note on the no-code row: Valitract covers both paths from the same engine, a drag-and-drop UI and a REST API, which matters when the person who needs the table is not the person who can write the script. For the wider category, see our guide to AI data extraction tools, and for the developer path specifically, our OCR API overview.
The honest boundary belongs right here, where the section is already drawing it. Valitract is an API and a hosted UI, with no open-source or self-hosted deployment, so a team whose data-sensitivity rules forbid any third-party API should use the local VLM row instead, not Valitract. That is a real constraint, and the local stack exists precisely for it.
What a Wrong Table Actually Looks Like
Most guides stop at “it might be inaccurate.” That is useless when you are staring at output trying to decide whether to trust it, so here are the concrete failure signatures to look for.
- Two columns merged into one, collapsing two fiscal years of figures into a single cell.
- A blank cell dropped, silently shifting every value in that row one column to the left.
- A merged header repeated across columns it does not actually apply to.
- A multi-page table returned as several unrelated tables, with no continuation between them.
- Footnotes and totals ingested as data rows, so a sum becomes another line item.
- Minus signs and decimal separators lost in OCR, which can flip the sign on a financial figure.
- Markdown output that silently flattens row spans, destroying the header hierarchy without any error.
The point that makes this list actionable is that character accuracy and structural accuracy are two different measurements. A tool can read every digit correctly and still put them in the wrong cells, scoring beautifully on text accuracy while being unusable on structure, which is the measurement that actually matters for a table.
How to Test PDF Table Extraction Accuracy Before You Commit
Test on your own worst documents, not on a vendor sample, and score structure separately from text. A demo file proves nothing; your messiest real documents prove everything. Here is a protocol that produces a decision rather than a vibe.
Assemble a test set that includes each of the five table types from the taxonomy above, not ten copies of your cleanest file. Then score the categories separately (simple, borderless, merged, multi-page, scanned) rather than reporting one average that hides the exact category that will break you in production. 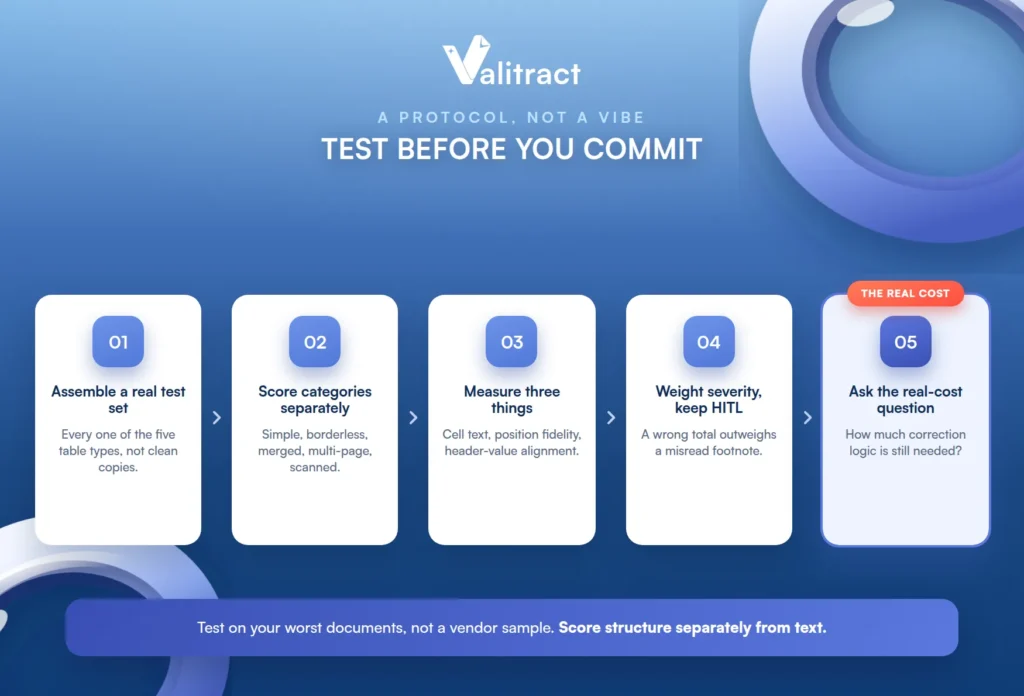
Measure three things independently: cell text accuracy, row and column position fidelity, and header-to-value alignment. These fail independently, and an average across them tells you nothing about which one is broken.
Add a severity weighting for financially material errors, because a wrong total is not equivalent to a misread footnote. Read the confidence scores the tool returns, and keep a human-in-the-loop step for low-confidence fields instead of trusting output that merely looks clean.
Finish with the practical question that decides real cost: how much correction logic is still needed after extraction? That number, not the headline accuracy claim, is what the tool actually costs you.
A free tier is enough to run exactly this test. Valitract’s is 100 pages a month with no credit card, which covers a real multi-type test on your own mix, and its reported up to 99.8% field-level accuracy applies to standard printed documents, so it is worth verifying against your scans and photos rather than assuming it transfers. For statement-heavy test sets, see bank statement data extraction.
Choosing an Output Format: CSV, JSON, XLS, Markdown, or HTML
The right output format is the one that minimizes downstream cleanup, not the one with the most features. Match it to what consumes the data, and to whether your tables have merged cells.
| Format | Best for | Limitation |
|---|---|---|
| CSV / XLS | Spreadsheets, BI tools, finance review | Only safe once the table is confirmed rectangular |
| JSON | Database loads, application logic, validation pipelines | Needs a defined schema to be useful |
| Markdown | RAG and LLM context windows | Cannot represent row or column spans |
| HTML | Complex tables with merged cells | Requires parsing before it reaches a database |
Merged cells are what decide this choice. If any of your tables span rows or columns, Markdown will quietly lose that structure, and the error surfaces much later as a wrong number rather than an obvious parse failure, which is the worst way for an error to arrive.

Common Mistakes in PDF Table Extraction
A handful of mistakes cause most of the pain, and each is avoidable once named.
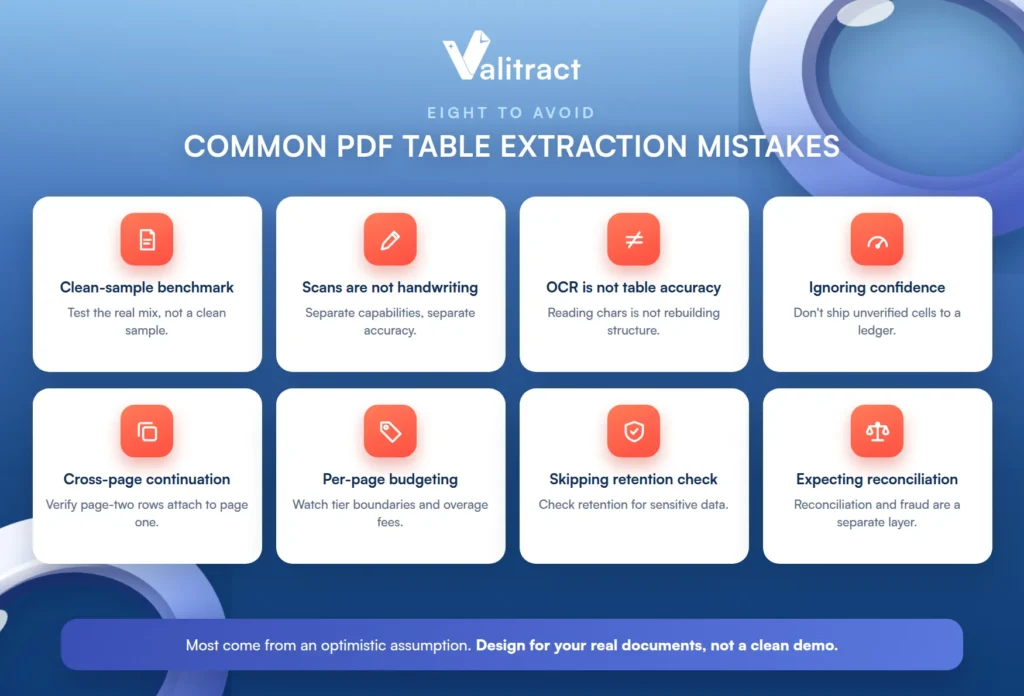
The first is benchmarking on a clean sample PDF that does not represent the real document mix. The second is assuming a tool that handles scans also handles handwriting, or the reverse, when these are separate capabilities with separate accuracy profiles; see handwriting recognition software.
The third is treating OCR accuracy as table accuracy. OCR reads characters, table extraction reconstructs relationships, and the second is where most pipelines actually fail, a distinction our guide to the difference between OCR and IDP covers in depth.
The fourth is ignoring confidence scores and shipping unverified cells straight into a database or ledger. The fifth is overlooking cross-page continuation, since verifying that page-two rows attach to the page-one table is a test most teams skip until a total comes out wrong.
The sixth is budgeting on per-page rates while missing tier boundaries, overage fees, and premium multi-page charges. The seventh is skipping the data-retention policy check when the documents contain financial or personal data.
The eighth is expecting an extraction layer to also reconcile documents against each other or detect tampering. That is a separate verification tool layer, and Valitract does not perform it; extraction structures and validates the table, and a different system handles reconciliation and fraud checks.
Frequently Asked Questions About PDF Table Extraction
What is PDF table extraction?
It is the process of recovering rows, columns, and cell relationships from a table inside a PDF and outputting them as structured data such as CSV, JSON, XLS, or HTML. The goal is a table a program can use, not just the loose text a basic copy-paste produces. The hard part is reconstructing the structure, because the PDF does not store it.
Why is extracting tables from a PDF so difficult?
Because a PDF stores characters at coordinates, not an actual table object with rows and columns. Every tool has to infer the grid from visual evidence like alignment and spacing, and that inference breaks on borderless, merged, multi-page, and scanned tables. The table you see is something your eye assembles, not something stored in the file.
How do I extract a table from a PDF into Excel?
For clean, text-layer PDFs with ruled tables, a free library like Camelot or pdfplumber exports directly to a dataframe you can write to Excel. For scanned or messy documents, an AI-native tool that outputs CSV or XLS handles the OCR and structure in one pass. Always confirm the table came out rectangular before trusting the spreadsheet.
Can you extract tables from a scanned PDF?
Yes, but only with a method that runs OCR first, because a scanned PDF has no text layer for coordinate-based tools to read. AI-native and vision-language extraction handle scans in a single pass by working from the page image. Coordinate tools like stream and lattice return nothing on a scan and often report no error, which is a common source of confusion.
What is the best free tool for PDF table extraction?
For text-layer PDFs with ruled tables, pdfplumber and Camelot are excellent and free, with Camelot adding a visual debugger and per-table accuracy score. Tabula is a good batch option if you have a Java runtime. None of these handle scans well, so free tools are the right choice specifically for clean digital PDFs.
Why did my tool return no tables from a PDF that clearly has one?
The most common causes are a scanned PDF with no text layer, or a financial PDF whose borders are drawn with text characters rather than real line objects. A line-based tool finds no lines to work with and returns nothing rather than an error. Check whether you can select the text, and whether the borders are real vectors or drawn characters.
How do you handle a table that spans multiple pages?
You need a method that recognizes the continuation and reattaches page-two rows to the page-one table, rather than treating each page as a separate table. This is a known weak spot, so it should be tested explicitly with a real multi-page document. Verifying that a total spanning pages comes out correct is the fastest way to catch a failure here.
Is PDF table extraction the same as OCR?
No. OCR converts an image into characters, while table extraction reconstructs the row, column, and cell relationships those characters belong to. A document can have perfect OCR and still produce a badly structured table, because reading the text and rebuilding the grid are different problems. Table extraction usually depends on OCR as a first step, but it is not the same thing.
Conclusion
PDF table extraction is hard because the table is not really in the PDF; it is an arrangement of glyphs that your eye reads as a grid and a tool has to reconstruct. Once you accept that, the path is clear: identify which of the five table types you have, match them to the right method, and test on your worst documents rather than a clean sample.
Free libraries win on clean, ruled, text-layer PDFs, and there is no reason to pay for those. AI-native extraction earns its place on the scans, photos, and messy mixes where the coordinate tools return nothing, and the right choice is whichever one leaves you the least correction logic to write afterward.