


- Table extraction is the process of locating a table inside a document and converting it into structured rows and columns that preserve which value belongs to which row, under which column header.
- The output is queryable data, not just the correct characters.
- In RPA tools like UiPath, “Table Extraction” means scraping tabular data out of a live application or web UI into a DataTable — a different job from reading a table off a PDF, scan, or photo. This article covers document table extraction.
What is table extraction, in the sense most people mean it? It is turning a table trapped inside a document into data a program can actually use, with every value still attached to its row and its column header. Getting the characters right is the easy half; keeping the grid intact is the half that breaks.
That distinction is the whole subject. A table can be read at perfect character accuracy and still come out useless, because the meaning of a table lives in its structure, not just its text. This guide explains why, where table extraction is used, the three stages it moves through, how the methods compare, and how to tell whether your own extraction actually worked.
Why OCR Alone Cannot Extract a Table
OCR converts pixels into characters, but a table’s meaning lives in its grid, so a table can be read at 100% character accuracy and still be destroyed. The characters are necessary and nowhere near sufficient.
The first reason is the reading-order problem. OCR emits text in a sequence, and no single sequence preserves a two-dimensional grid: read it row-wise and the column relationships vanish, read it column-wise and the row relationships vanish. The grid is lost the moment it becomes a line of text.
The second is that a value means nothing without its coordinates. The number “15.00” carries information only as the unit price for a specific line item under a specific column; stripped of its position, it is just three digits.
The third is that PDFs make this worse rather than better. A PDF stores text positioned at coordinates, with no embedded metadata declaring where the tables, rows, or columns are, so structure has to be inferred rather than read. Our guide to OCR data extraction covers that underlying layer in full.
The consequence for buyers is direct: a character-level or page-level accuracy figure says nothing about whether the grid survived. A vendor can be entirely honest about reading 99% of characters correctly and still hand you a table with its columns scrambled.
Where Table Extraction Actually Gets Used
Table extraction shows up wherever the important information lives in a grid rather than a paragraph. Organizing by document type is the fastest way to find yourself here.
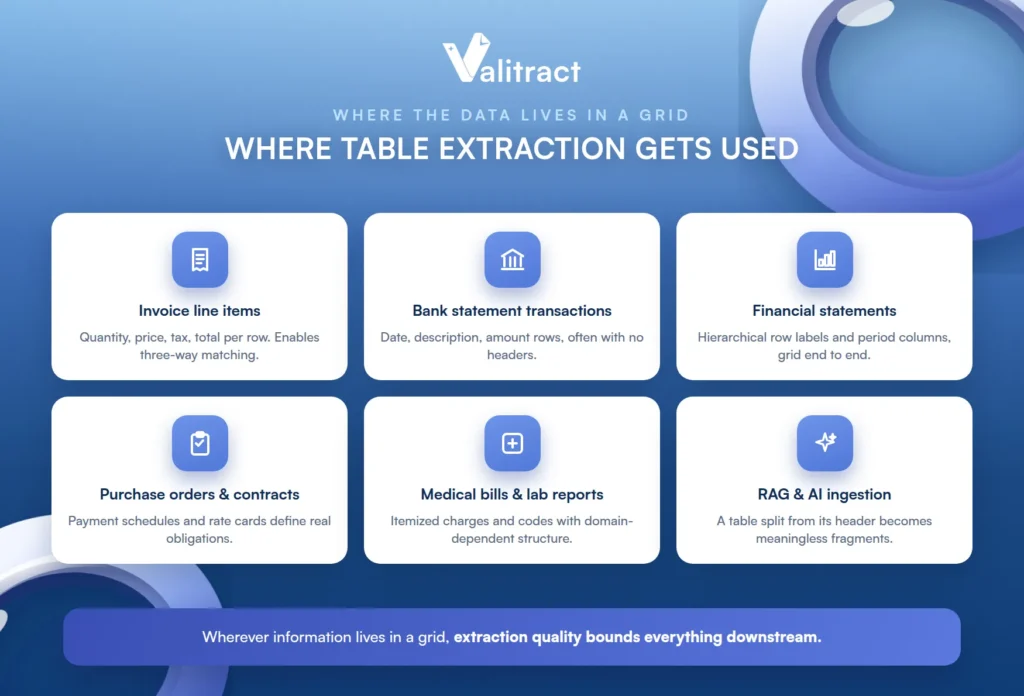
Invoice line items carry quantity, unit price, tax, and line total per row, and it is this table that makes three-way matching possible. Lose the row structure and the match cannot run.
Bank statement transactions are date, description, and amount rows, often with no headers at all and no consistent debit or credit convention between institutions. Our guide to bank statement data extraction covers that variability in depth.
Financial statements such as balance sheets and income statements are tables end to end, with hierarchical row labels and period columns that only make sense as a grid.
Purchase orders and contracts contain payment schedules, rate cards, and pricing tables that define real obligations, so a misread cell is a misread commitment.
Medical bills and lab reports carry itemized charges and procedure codes, plus tables whose structure depends on domain knowledge that is not printed anywhere on the page.
RAG and AI ingestion is the newest case: a table split from its header row during chunking produces retrievable fragments whose cells have lost their meaning, so extraction quality bounds answer quality on any table-based question. If the table is mangled going in, no amount of model quality recovers it.
The Three Stages of Table Extraction
Table extraction is three sequential problems, not one, and each has its own failure mode. Treating it as a single step is why so many pipelines break in a way nobody can locate.
Table detection
The first stage locates which regions of the page are tables, as opposed to paragraphs, forms, multi-column text, or lists that merely look tabular. A detection miss loses the table silently, because the surrounding prose extracts normally and nothing signals that a table was skipped.
Table structure recognition
The second stage identifies row and column boundaries, header rows versus data rows, and which cells span multiple rows or columns. This is where most tools fail: they correctly detect that a table exists and then misread its shape, which is the harder and more consequential problem.
Cell extraction and output
The third stage reads each cell’s text, binds it to its position in the recognized grid, and serializes the result to a format that keeps the relationships, whether nested JSON, CSV, XLS, HTML, or Markdown. Valitract’s table extraction preserves row and column relationships as it does this, with JSON, CSV, and XLS as the practical downstream formats, so the grid that survived recognition also survives export.
How the Three Extraction Methods Compare
The right method depends on whether your documents are digital-native and layout-stable, or scanned and varied. The comparison is the decision, so here it is directly.
| Method | How it works | Best fit | Main limitation |
|---|---|---|---|
| Library / rule-based (Camelot, Tabula, pdfplumber) | Reads embedded text coordinates; lattice mode for ruled tables, stream mode for borderless | Clean, text-based PDFs with stable layouts; zero per-page cost | No scan support; column splitting and merging needs constant parameter tuning |
| OCR plus layout analysis | Converts pixels to characters, then reconstructs the grid from bounding-box geometry | Scanned and image-based documents | Staged pipeline propagates errors; quality depends heavily on scan condition |
| AI / VLM-based extraction | Layout-aware models detect tables and reconstruct structure from visual and semantic cues, template-free | Varied, irregular, and mixed-format documents at volume | Higher cost per page; models can hallucinate plausible-but-wrong cell values |
The library route is genuinely the right answer for clean, ruled, digital PDFs, and it is free; the AI route earns its cost on scanned and varied documents where the others return nothing usable.
The hallucination point deserves its own emphasis, because it is the newest real risk and most comparison pages skip it. An OCR engine that fails tends to fail visibly, with garbled characters you can see, while a generative model can invent a clean-looking value that reads as correct and is not. That is the entire argument for confidence scores and review over blind trust, and it is why our guide to IDP vs OCR matters for deciding which layer you actually need.
What Accuracy to Actually Expect, by Table Type
The flat “99% accurate” claim that dominates search results hides the fact that accuracy varies enormously by table type. Here is a more honest picture to test any vendor against.
| Table type | Typical accuracy | Difficulty | What breaks first |
|---|---|---|---|
| Ruled grid, digital-native PDF | 95 to 99% | Easy | Little; the safest baseline |
| Borderless / whitespace-aligned | 85 to 95% | Medium | Column boundary detection |
| Merged or multi-level headers | 80 to 95% | Medium | Header-to-cell scope |
| Multi-page tables | 75 to 90% | Hard | Header repetition, boundary rows |
| Nested tables | 70 to 85% | Very hard | Flattening into unusable output |
| Handwritten tables | 60 to 80% | Very hard | Cell-level character recognition |
Ranges vary by document quality and tool; treat them as directional and test on your own mix rather than trusting a single headline figure.
The distinction that matters most sits underneath every number in that table: field-level accuracy and table-structure accuracy are different claims. Valitract’s reported up to 99.8% field-level accuracy on standard printed documents describes field capture, not a guarantee that a nested or handwritten grid reconstructs perfectly, and no vendor’s headline number does either. Reading the first as if it were the second is the most common way buyers get surprised in production.
How to Tell Whether Your Extraction Actually Worked
Most guides assert accuracy; almost none explain how to verify it. These four checks tell you whether the grid actually survived, rather than whether the characters did.
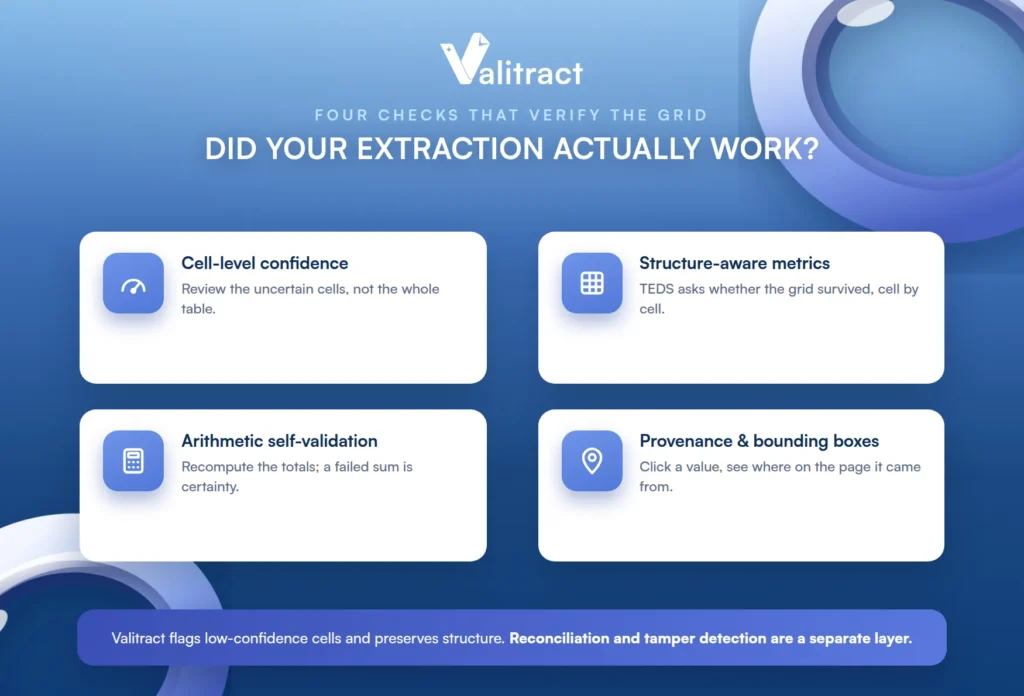
Cell-level confidence, not document-level. Table-level confidence forces you to review the whole table; cell-level confidence narrows review to the specific uncertain cells. Valitract’s low-confidence flagging and side-by-side validation UI are a concrete example of this, which is the shape of practical human-in-the-loop document processing.
Structure-aware metrics. Measures like tree-edit-distance similarity (TEDS) exist precisely because character accuracy cannot describe whether a grid survived. Ask a vendor what fraction of tables survive with structure intact, measured cell by cell and reported by document family rather than averaged into one flattering number.
Arithmetic self-validation. Tables that carry their own math, where line items sum to totals, quantity times rate matches the amount, and debits and credits reconcile, can be recomputed after extraction. A failed recomputation is a certainty-grade error signal rather than a probability, which is why automated data validation belongs in the pipeline.
Provenance and bounding boxes. Being able to click an extracted value and see where on the page it came from is what makes an error debuggable rather than mysterious. Without provenance, a wrong number is just a wrong number with no trail back to its source.
The honest boundary belongs right here, not in a disclaimer. Valitract flags low-confidence fields and preserves table structure, but it does not perform cross-document reconciliation or document tamper detection, which belong to dedicated verification platforms. Teams whose data-sensitivity rules exclude any third-party API should also know there is no self-hosted deployment option, and a local toolkit is the right answer for them.
Where Table Extraction Breaks: The Failure Catalog
Practitioner threads describe these failures far more precisely than vendor pages do, so here is the catalog, each item naming the layout feature and the corruption it causes.
- Merged and spanning cells lose their scope when flattened, so a category label spanning several rows, or a header spanning several columns, ends up attached to the wrong cells.
- Multi-level headers like “Q1 2026” over Jan, Feb, and Mar produce data that is technically accurate and practically useless if you extract a number without both header levels.
- Borderless and whitespace-delimited tables have structure implied by alignment only, with no ruling lines to detect, so column boundaries become guesses.
- Multi-line cells, where a description wraps across three lines, read as three separate rows to a line-based engine.
- Multi-page tables print headers once and continue data for pages, so repeated headers get re-extracted as data rows and rows at the page boundary get corrupted or dropped.
- Nested tables, a breakdown table inside a cell, common in financial documents, get flattened into nonsense or ignored entirely.
- Rotated, skewed, and photographed tables degrade both detection and structure recognition through landscape orientation, camera glare, and geometric distortion.
- Column misalignment is the single most consequential failure: quantity lands in the unit-price column, the row’s arithmetic is now wrong, and nothing is flagged.
- Handwritten tables are the hardest tier, where cell-level character recognition itself becomes the limiting factor; see handwriting recognition software.
How to Test Table Extraction on Your Own Documents
The only test that predicts production behavior is your own worst documents, not a vendor’s sample. Here is a protocol that takes an afternoon and saves a rollout.
Pick the hard cases deliberately: one merged-header table, one borderless table, one multi-page table, one photographed or scanned page, and one handwritten table if you have them. A clean ruled sample proves only that the easy case works.
Run the column-level question test next. Try to answer a real question about one column using only the extracted output, and if you have to open the original document to do it, the characters were extracted but the table was not.
Recompute the arithmetic before believing anything else about the output. Sum the line items and compare to the printed total, because a failed sum tells you the extraction is wrong with certainty rather than suspicion.
Finally, check the output format against your destination: nested JSON for a pipeline, CSV or XLS for a spreadsheet workflow, and confirm the row and column relationships survive the export. A free tier is the practical way to run this whole test, and Valitract’s covers 100 pages a month with no credit card, which is enough for a real multi-type run; our overview of the document parsing API covers the output-format options.

Common Mistakes in Table Extraction
A few recurring mistakes cause most of the gap between a promising pilot and a disappointing rollout.
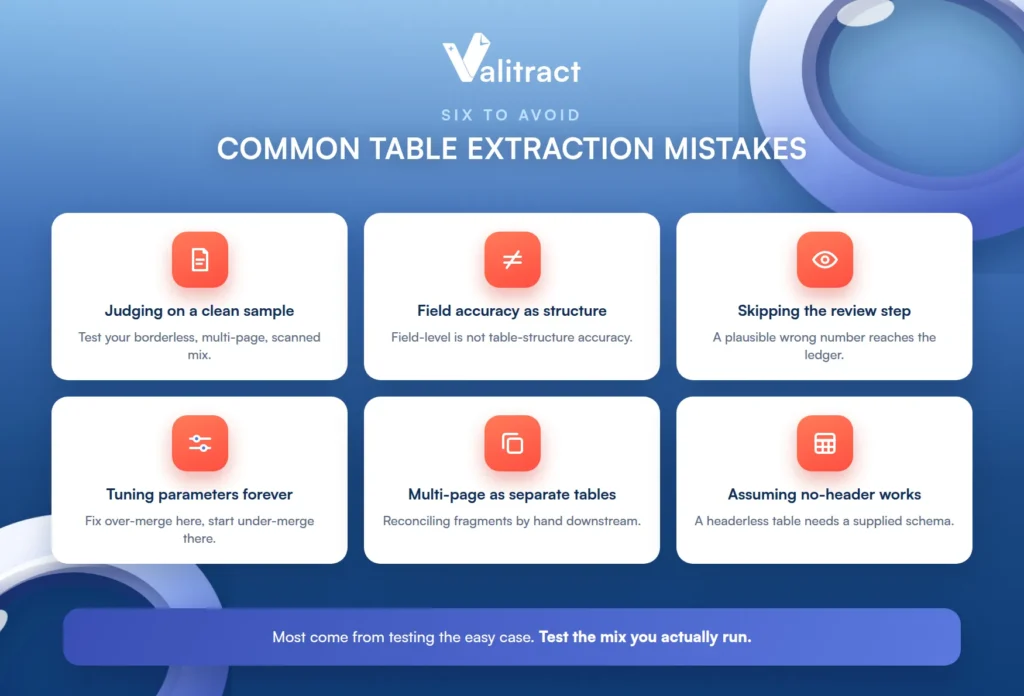
The first is judging a tool on a clean, ruled sample when the production mix is borderless, multi-page, and scanned, which is the single most common cause of that gap. The second is reading a field-level or character-level accuracy figure as a table-structure guarantee, when they measure different things.
The third is ignoring confidence scores and skipping review, which lets a plausible wrong number reach a ledger or a model unflagged. The fourth is tuning library parameters indefinitely, since pdfplumber and Camelot settings that stop over-merging columns on one document routinely start under-merging on the next, a structural limit of coordinate-based parsing rather than a configuration failure.
The fifth is treating multi-page tables as separate tables and reconciling them by hand downstream. The sixth is assuming a table with no header row will be interpreted correctly without supplying the schema.
Frequently Asked Questions About Table Extraction
What is table extraction?
It is locating a table inside a document and converting it into structured rows and columns that keep each value bound to its row and column header. The output is queryable data rather than a stream of correct characters. The hard part is preserving the grid structure, not reading the text.
What is the difference between table extraction and OCR?
OCR converts an image into characters, while table extraction reconstructs the rows, columns, and cell relationships those characters belong to. A document can have perfect OCR and still produce a scrambled table, because reading text and rebuilding a grid are different problems. Table extraction usually depends on OCR as a first step but is not the same thing.
What is the difference between table detection and table structure recognition?
Table detection finds where the tables are on the page; table structure recognition works out the rows, columns, headers, and spanning cells inside a detected table. Detection failures lose a table silently, while structure failures produce a table with the wrong shape. Most tools detect tables well and misread structure, which is the harder stage.
Can table extraction handle tables without borders?
Yes, but borderless tables are harder because the column boundaries exist only as whitespace with no ruling lines to detect. Coordinate-clustering and layout-aware methods infer the columns from alignment, and AI-native approaches handle them more robustly. Expect lower accuracy on borderless tables than on ruled ones, and test them specifically.
How does table extraction handle tables that span multiple pages?
It has to detect that a table continues across a page break and stitch the fragments back into one logical table, reattaching later rows to the original headers. Naive page-by-page tools return one fragment per page and often re-extract repeated headers as data rows. This is a known weak spot, so multi-page tables should be tested explicitly.
Can ChatGPT or another LLM extract tables from a PDF reliably?
LLMs and vision-language models can extract tables and handle varied layouts well, but they carry a specific risk: a generative model can invent a clean-looking but wrong cell value rather than failing visibly. That makes confidence scores, arithmetic checks, and human review more important, not less. For production use on financial data, verification matters more than the model alone.
What accuracy can I expect from table extraction?
It ranges from roughly 95 to 99% on clean ruled digital PDFs down to 60 to 80% on handwritten tables, with borderless, merged-header, multi-page, and nested tables in between. Field-level accuracy and table-structure accuracy are different numbers, so ask which one a vendor is quoting. Test on your own document types rather than trusting a single averaged figure.
What output formats does table extraction produce?
Common formats are nested JSON for pipelines and application logic, CSV or XLS for spreadsheet and finance workflows, and HTML or Markdown for documents and LLM context. The right choice is the one that preserves your tables’ structure, especially if they contain merged cells, since Markdown cannot represent row or column spans. Confirm the relationships survive the export before you rely on it.
Conclusion
Table extraction is not OCR with extra steps; it is the separate problem of keeping a grid intact while OCR keeps the characters intact. A table can be read perfectly and still arrive scrambled, which is why the useful question is never “how accurate is the text” but “did the structure survive.”
Test that on your own hardest tables, measure structure separately from characters, and keep a review step on the cells a tool is unsure about. Get that right, and the table that started life trapped in a PDF comes out as data you can query, reconcile, and trust.